
Green Producers Tool
The Green Producers Tool is an activity-based emissions calculator tailored for the cultural and sports sector.
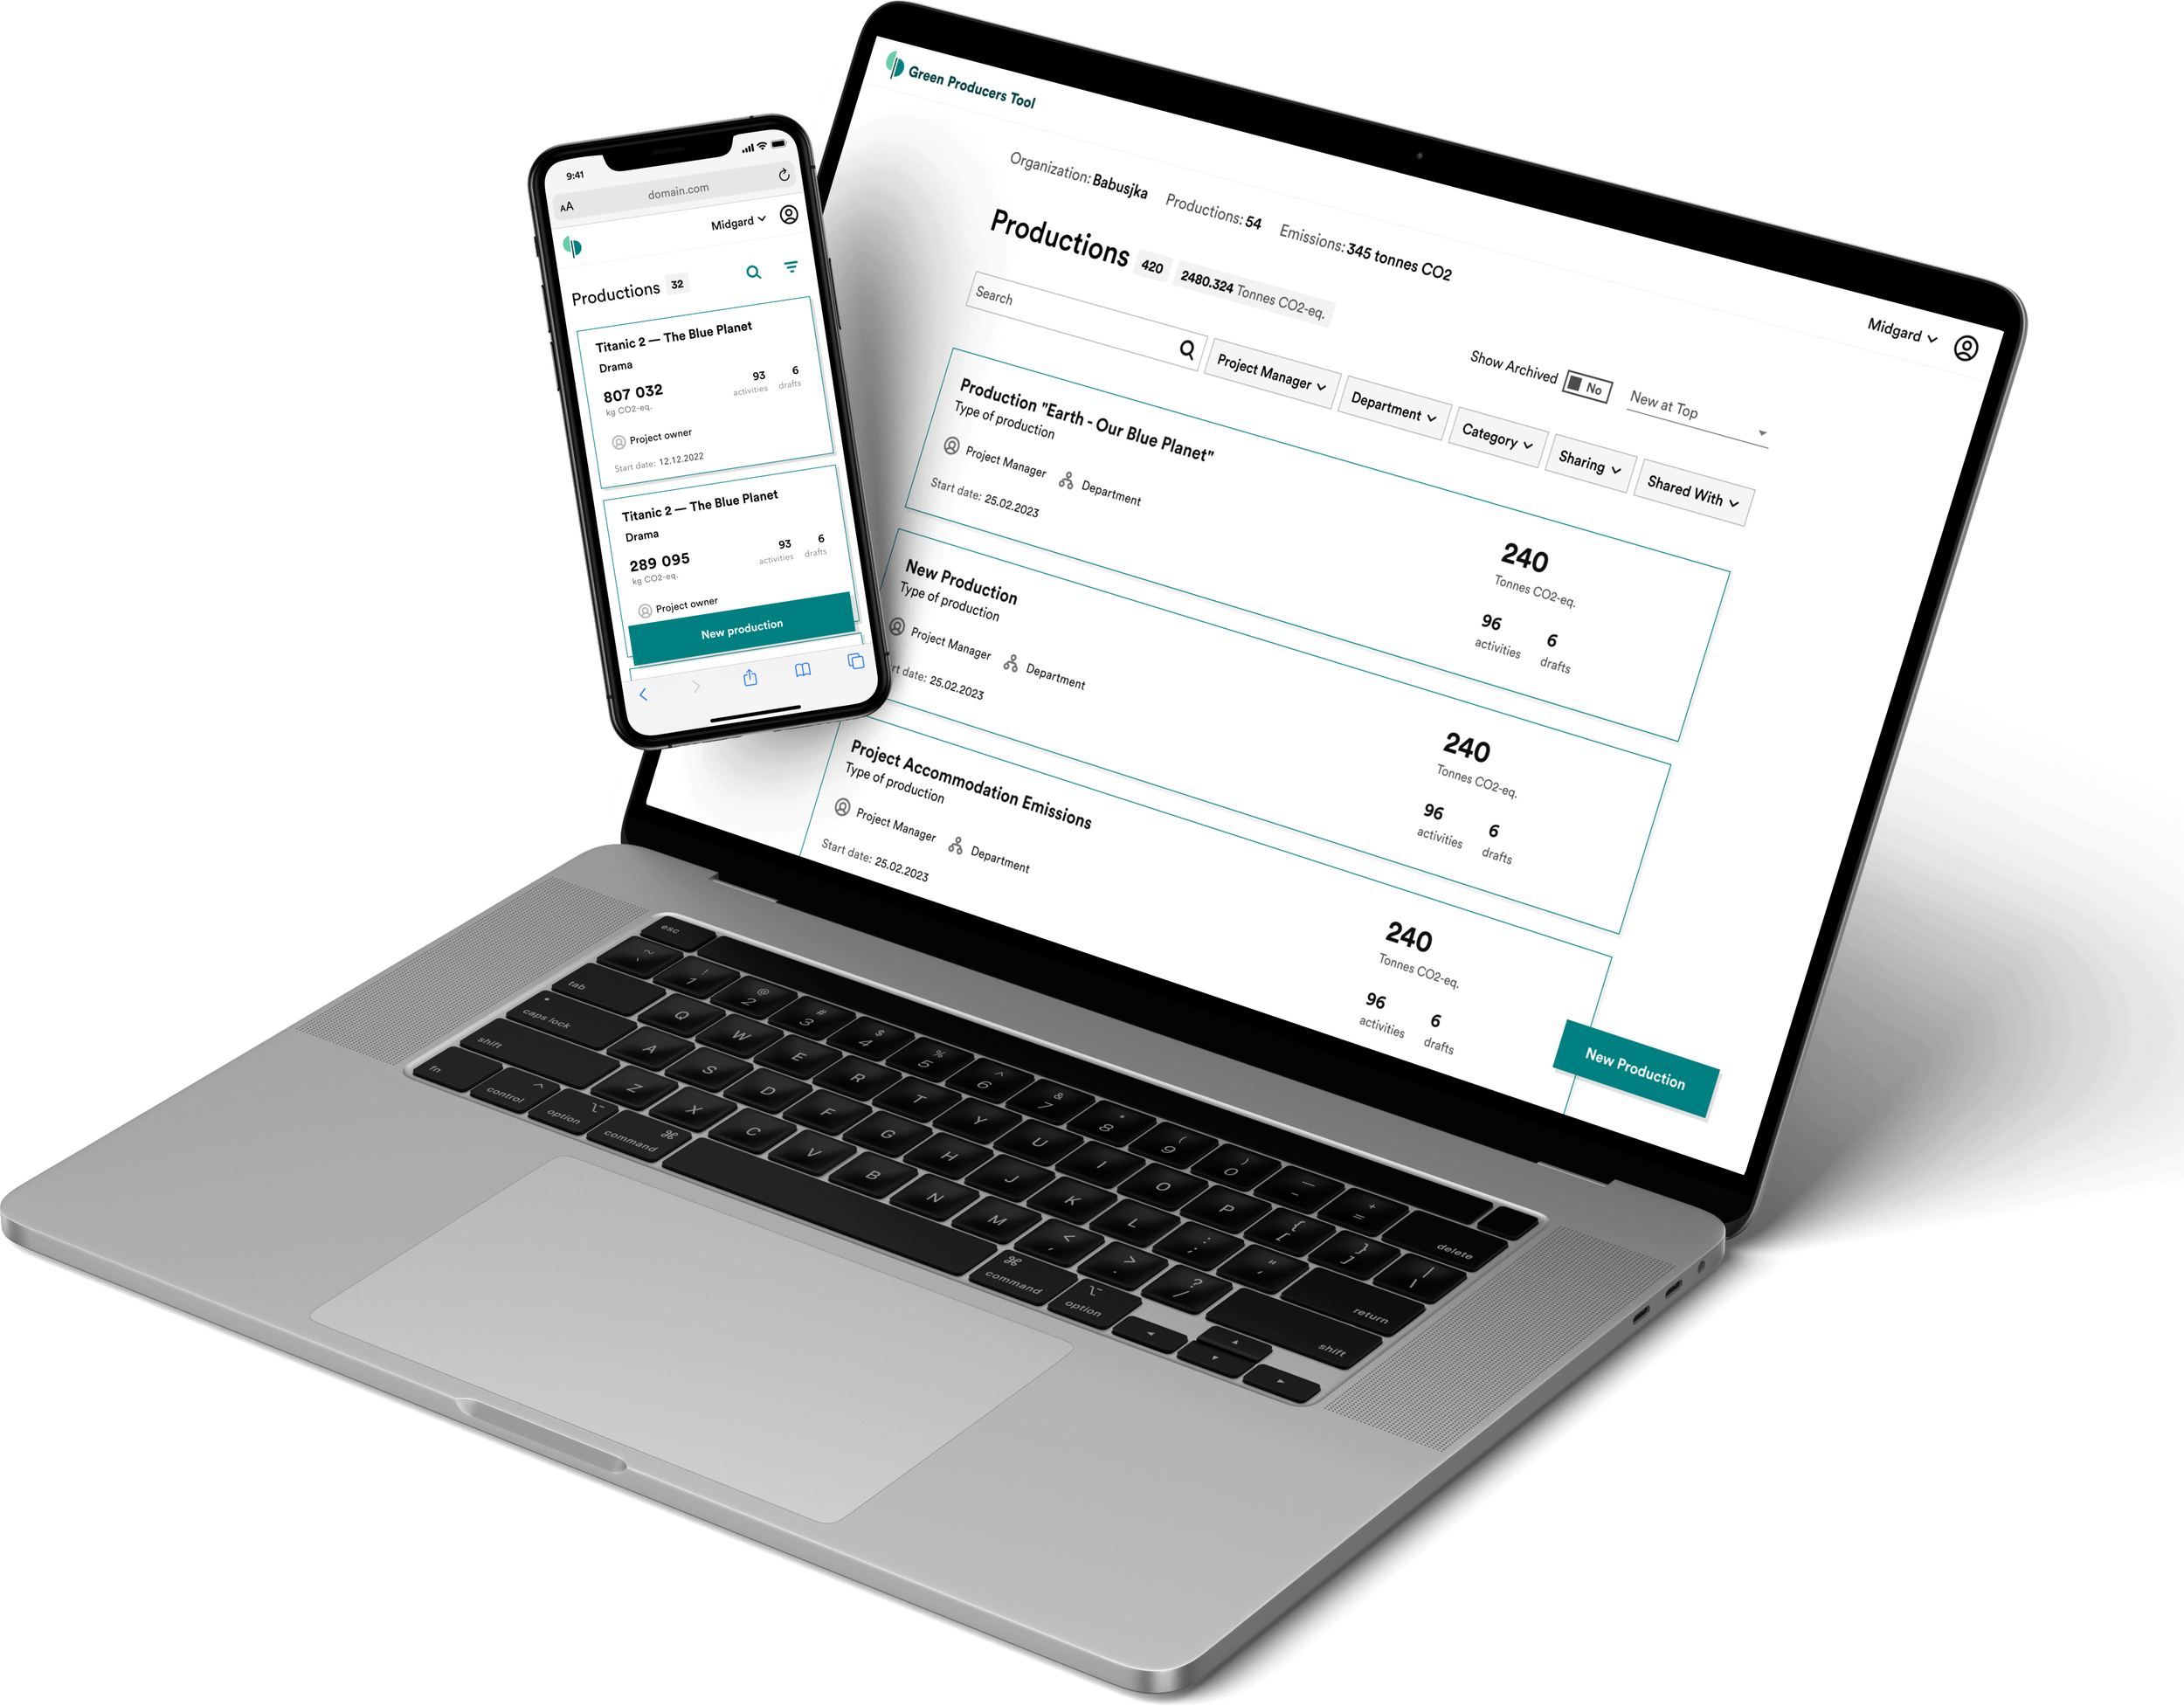
With over 7,000 projects calculated and 600+ organisations using the tool across Europe, GPT helps you reduce your emissions.
The Tool is in constant development, updated monthly with new climate research and real user feedback. It is designed with producers, by producers, together with our members, developers at Innocode, and our Club Partners.
Make Knowledge Based Decisions
Don’t just report your footprint, plan it.
The Tool allows you to map out your projected emissions before a project even begins. Compare different logistical choices, adjust your planning and systematically lower your impact from day one.
Use Industry Approved Templates
Skip the blank spreadsheet panic.
Access pre-built templates co-created with industry professionals and tailored specifically to you. Start your project with a proven framework, not from scratch.
AI Document Reading
Use our integrated AI assistant to speed up, and assure your work is of the highest quality.
Simply upload PDFs, spreadsheets, or receipts, and our integrated AI assistant will extract the relevant data and convert them into activities. Our AI assistant pulls data from within the Tool, ensuring your work is research based.
Create Insightful Reports
Turn complex data into clear narratives.
Export professional, credible emissions reports tailored for funding bodies, partners, and stakeholders. Once your project wraps, sharing your verified climate achievements takes just a click.
Streamline The Workflow
Eliminate the data-collection headache.
Use the Send Bundle feature to delegate data entry tasks directly from within the platform. Gather emission inputs from internal departments or external crew members .
Made for Your Industry
The Tool is built for the reality of how cultural and sports productions actually work.
Track and categorise emissions accurately across distinct industry phases, from transport and scenography to arena footprints and post-production.
See The Big Picture
Track your long-term progress and identify which areas to focus on.
The Statistics dashboard aggregates your data over time, giving you the power to spot patterns, compare different years or departments, and continuously refine your emission reduction strategies.